What the Data Means
The Prompt Tracking Chart
This chart shows your citation performance over time with two key lines:
Tracked Prompts (gray line) — The total number of prompts that were scanned on each date. This may differ from your current prompt count if you've added or removed prompts over time.
Cited Prompts (green line) — How many of your tracked prompts resulted in your brand being mentioned by at least one AI model.
Reading the chart
- Dates run along the bottom (X-axis)
- Number of prompts runs along the left side (Y-axis)
- Hover over any data point to see the exact counts and citation rate for that day
Citation Rate — Shown in the header stats as a percentage. This is calculated as: (Cited Prompts ÷ Tracked Prompts) × 100
Example: If 5 out of 20 prompts got you cited, your citation rate is 25%.
Header Stats Explained
At the top of the chart, you'll see three key metrics:
| Metric | What It Means |
|---|---|
| Tracked | Number of prompts scanned in the most recent run |
| Cited | Number of prompts where your brand was mentioned |
| Rate | Your citation rate as a percentage |
Trend Arrows:
- Green arrow up = Improvement from previous scan
- Red arrow down = Decline from previous scan
- Number next to arrow = Amount of change
Your Mentions Section
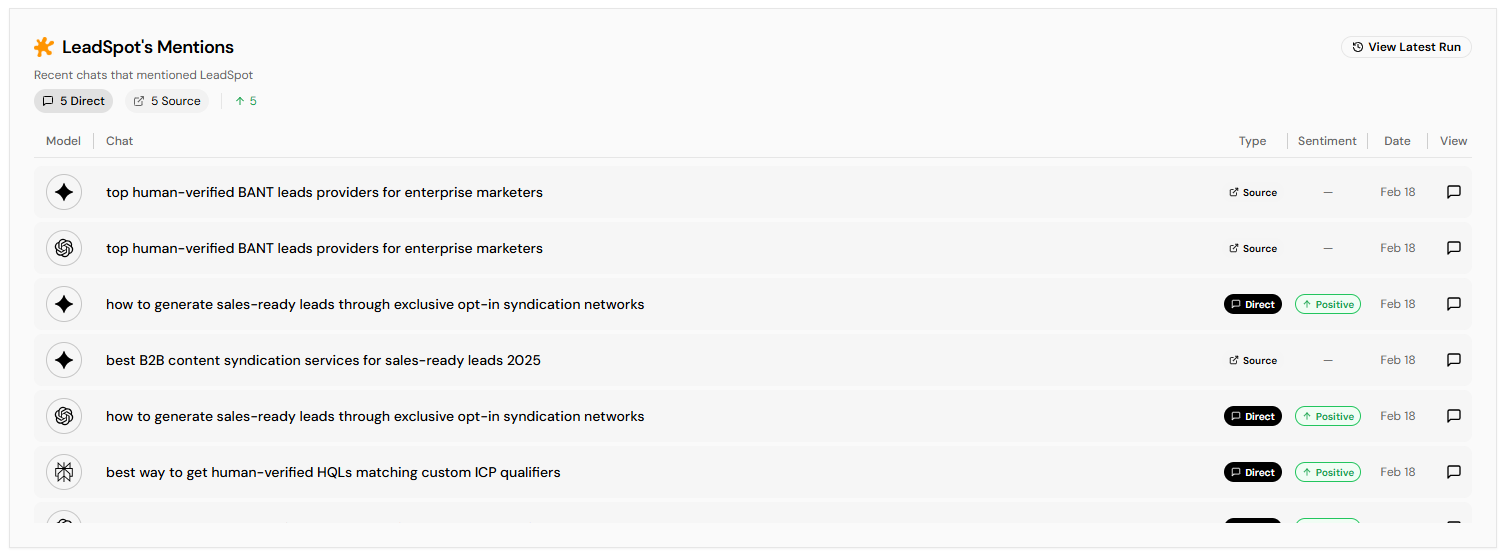
This table shows every instance where an AI mentioned your brand:
| Column | What It Shows |
|---|---|
| Model | Which AI system cited you (ChatGPT, Gemini, or Perplexity) |
| Chat | The prompt/question that led to the citation |
| Cited | The domain that was cited (your domain) |
| Date | When the scan detected this citation |
| View | Click to see the full AI response |
Reading AI Responses: Click the speech bubble icon to open the full AI response. This shows exactly what the AI said and how your brand was mentioned in context.

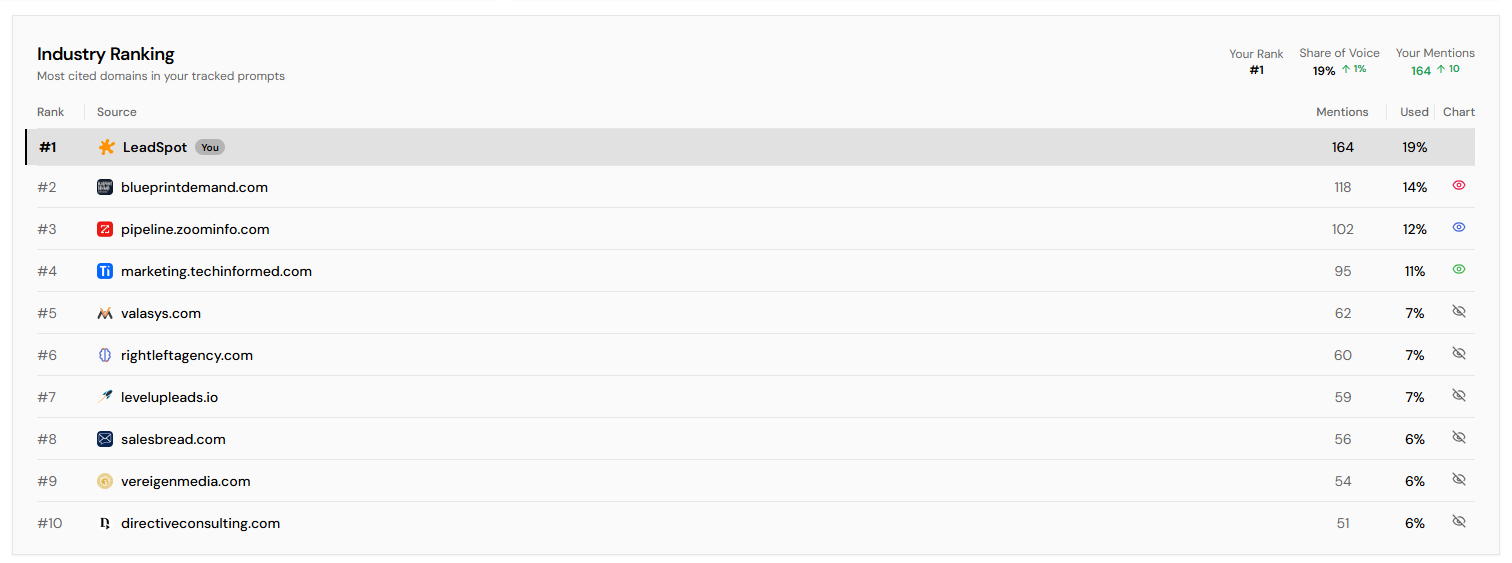
Industry Ranking Section
This shows who's winning the AI visibility game in your space.
Your Rank — Where you stand compared to all competitors found in your tracked prompts. #1 means you're cited most often.
Share of Voice — Your citations as a percentage of all citations (yours + top 10 competitors). Higher is better.
Your Mentions — Total number of times your brand was cited across all prompts and models.
The Competitor Table:
- Rank — Position based on citation count
- Source — Competitor domain with favicon
- Mentions — How many times this domain was cited
- Used — Their share of voice percentage
Understanding the "View Latest Run" Dialog
Click the "View Latest Run" badge to see detailed results from the most recent scan:
Filters:
- All — Every prompt that was scanned
- With Citations — Only prompts where you were cited
- Without Citations — Prompts where you weren't mentioned
For each prompt, you'll see:
- The exact prompt text
- Whether it was cited (green badge) or not (gray badge)
- If cited: which AI models cited you and how many times
- The AI model logos for quick identification
Prompt Categories
Categories help you organize prompts by topic, funnel stage, or any grouping that makes sense for your business.
How categories affect the chart:
- Click a category button above the chart to filter to just that category
- The chart will show only prompts in that category
- Citation rate recalculates for the filtered view
Category Stats (in legend):
- Category color dot
- Category name
- Citation rate for that category
- Number of prompts in category
Citation Status Badges on Prompts
In the Tracked Prompts list, each prompt shows a status badge:
| Badge | Meaning |
|---|---|
| Cited (green) | Your brand was mentioned in AI responses for this prompt |
| No citations (gray) | Your brand wasn't mentioned for this prompt yet |
Trend Indicators Explained
Throughout the dashboard, you'll see small arrows next to numbers:
- ↑ (green) with a number = Positive change from last scan
- ↓ (red) with a number = Negative change from last scan
- No arrow = No change or first scan
For Rank, the logic is inverted:
- ↑ with a positive number = You moved UP in rank (good)
- ↓ with a negative number = You moved DOWN in rank (bad)